Widgets
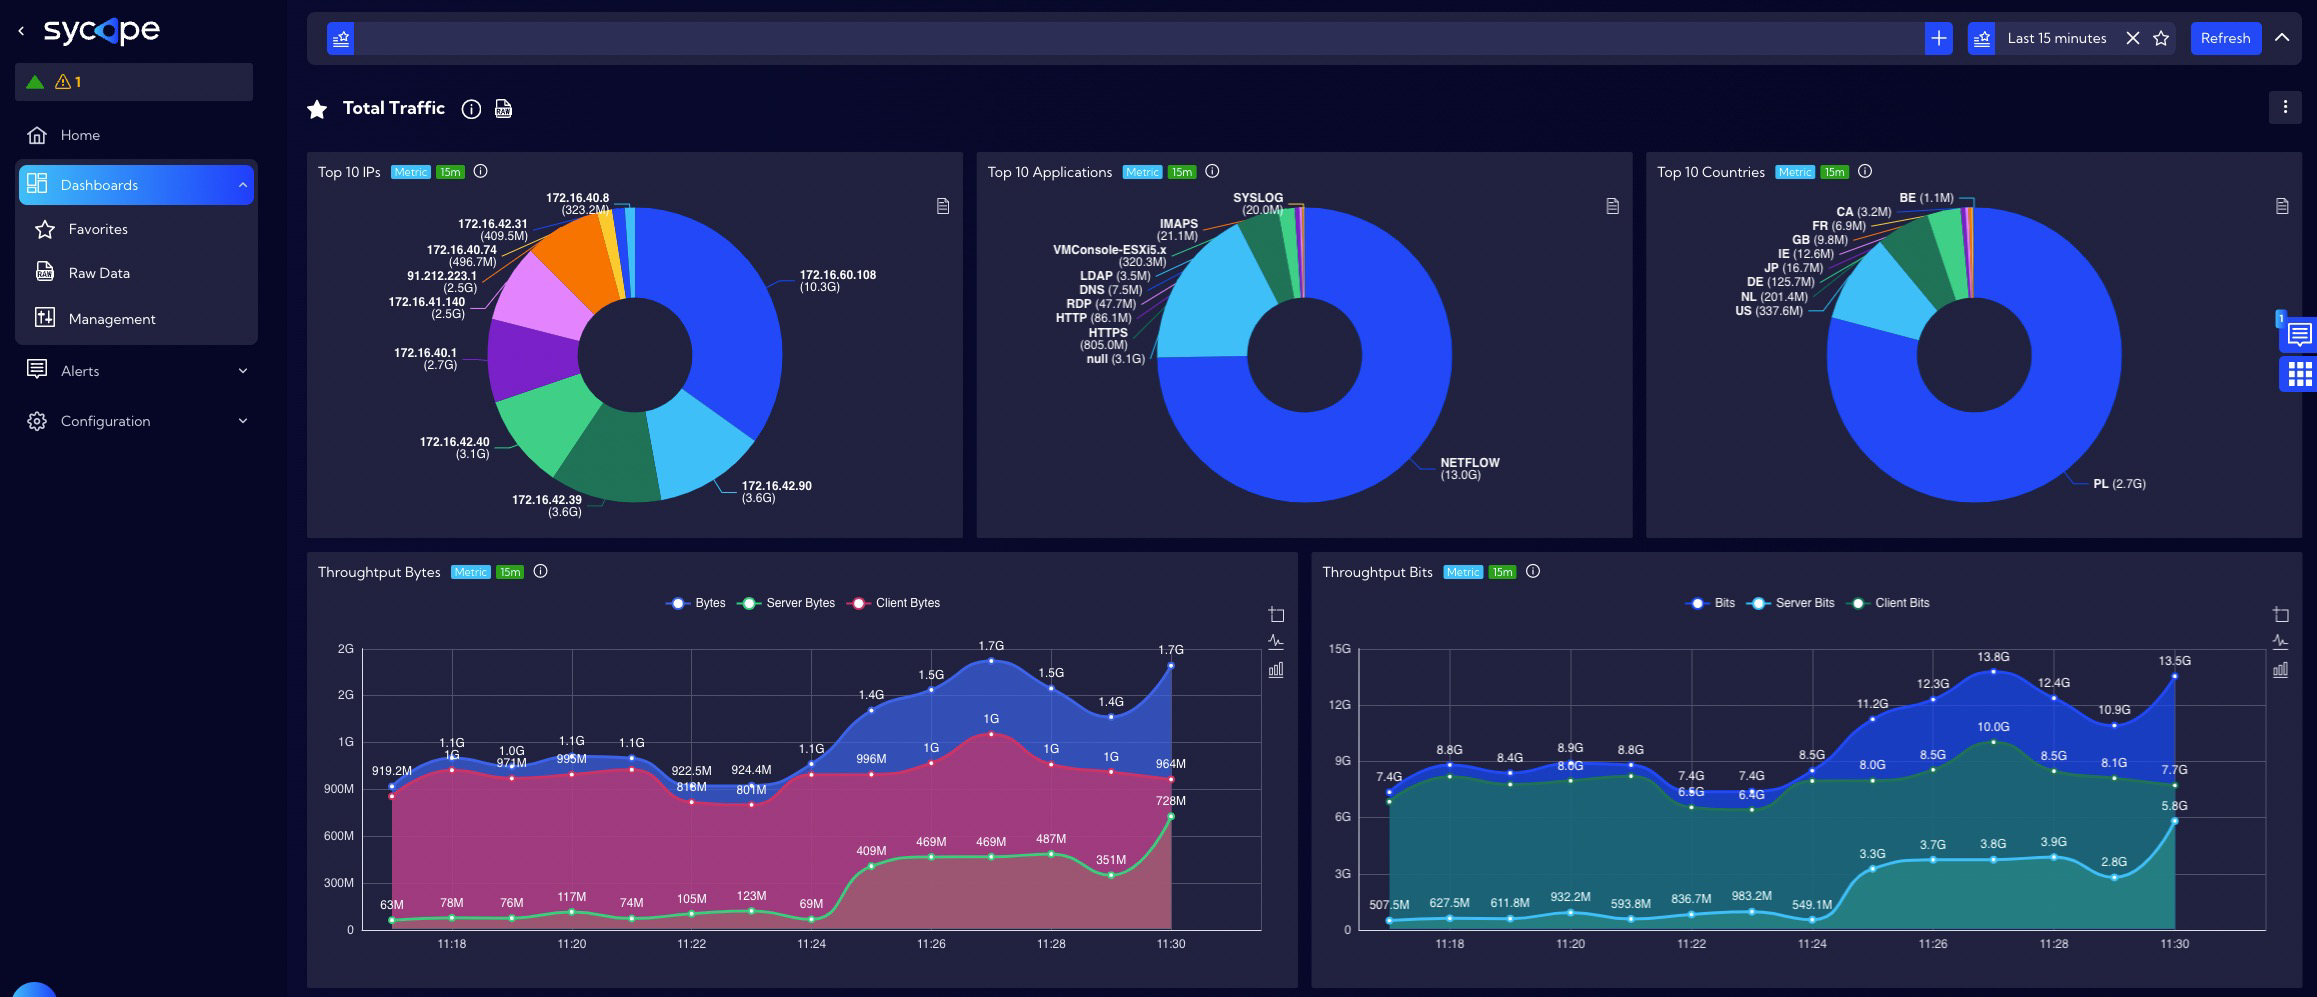
One of the most important elements of the system are Widgets. Widgets are designed to display information of a certain kind and source, which can be a summary, a value calculated from multiple data, a graph or a function, etc.
Sycope includes a lot of different types of widgets, designed to fulfill different data display needs. You can add, remove, and customize widgets to personalize your dashboard, displaying just the data you need. Widgets are used to create dashboards, which are views that contain multiple widgets.

The system contains built-in Widgets a list of which can be found in the [Dashboard>Management>Widgets] menu. Based on the built-in Widgets you can create your own by selecting the Duplicate button from the Actions column and then modify selected Widget elements. After saving the Widget with a new name, it is ready to use and will appear on the list in the Widgets table.
Select - checkbox button - to select for further editing
Favourite - star icon - to add to favorites
Type - Widget type: Line, Scatter, Bar …
Name - unique Widget name
Tag - assigned tags
Description - Widget description entered by user
Privacy - privacy status icon
Shared - name of the user who shared the Widget
Created By - name of the user who created the Widget
Creation Time - creation time
Modified By - name of the user who last modified the Widget
Modification Time - last modification time
Streams - data streams used to create Widget
Used in - objects in the System where the Widget is used
Action
- Duplicate - creating an editable copy of the Widget
- Export - exporting the Widget to file in json format
- Edit - edit a created Widget
- Delete - delete a selected Widget
Adding custom widgets
Widgets are created and edited in this menu [Dashboard>Management>Widgets]. To add a widget, click on the Add Widget button, then the widget wizard will appear. The procedure for creating a widget consists of three or four steps depending on the visualization type selected in the first step.
The system includes the following types of visualization:
- Line
- Scatter
- Bar
- Gauge
- Pie
- Graph
- Map
- Sankey
- Sunburst
- Tree
- Tree Map
- KPI
- Table
- Text Image
- Filters
- Radar